
For some time now, I wanted to reflect upon some DIY experiences with learning while mapping, i.e. putting information on a map. While learning is DIY by definition - nobody can make you learn - , it’s also a play of words, since the device used to generate the coordinates for the map is also the result of a DIY effort, combining existing electronics, e.g. a GPS receiver and a (capacitive) touch sensor as interface. Similarly, the software used to analyze and visualize the data is an interactive Python notebook, which is DIY too. Of course, DIY is mostly remixing existing components into a new solution. For now, just a side note: DIY also requires us to learn when to be lazy imitators (aka cooky cutters) by virtue of copy and paste, to get things done. Personally I try to keep a tally of things ‘to look into later’. Geographical information systems and mapping tools such as QGIS or Mapnik, would be an example, what else could be learned in the context of mapping. However, I’ve covered that area already by looking into the reliability of GPS signals as well as the way python notebooks can be of help.
This post is about learning while doing the actual mapping, i.e. walking around with a specific idea in mind on what should be captured on the map and what categories would help me to achieve this in a straight forward way. ‘Straight forward’ implies a category shouldn’t be excessively rare (I can only define 5 categories and don’t want to waste them on outliers) and categories should have discriminatory powers, i.e. I want to minimize my doubts when categorizing an observation on the go.
To make it as concrete as possible, I’ll take my last mapping journey as an example.
I wanted to see which one of my beloved restaurants / food places are still open and how they are coping with Covid19 related regulations,
My first intuition was to have three categories ‘open’, ‘open at different hours’, ‘closed’. However, in the end, I will have all 5 categories in use, which means I had to change the way I was categorizing the responses to Covid19 regulations.
So what does this have to do with learning? Unfortunately (or maybe not) there is no single, universally accepted definition of learning. Depending on your paradigmatic position, you can have more behavioral, cognitive or social-constructivist views on learning. Also, each definition will describe learning processes or learning outcomes differently. So what can we take from this?
I think all learning theories include an element where learning is described as lasting change. So basically, we have a more or less explicitly formulated understanding, which we can change through experience. However, what exactly counts as ‘experience’ and what we mean by ‘lasting change’ is a matter of debate and it’s the point where ‘sometimes competing’ learning theories enter the field. For a more in-depth, text-book-like discussion I recommend ‘Hergenhahn, B. R., & Olson, M. H. (2005). An introduction to theories of learning (7th ed.). Pearson Prentice Hall.‘
I believe having different points of view is not an unusual situation in science and research and it also applies to theories of learning. Still, having these multiple lenses on learning can be useful because they add to the big picture of what we can do to make learning easier. Not that it should be always easy, as in ‘Don’t make me think’ – which is a great book btw -. But if I want to learn ’Thing A’ then having to think about ’Thing B’ doesn’t really help.
Anyway, behaviorists would emphasize elements of repeating, and receiving meaningful, possibly corrective, feedback. Feedback is not such an obvious thing when mapping, e.g. there is no outright wrong way of putting a dot on a map. Of course, if we were to know up-front what the mapping is about, we could think of patterns which should be avoided. But if the general task is ‘map your observations’ I couldn’t think of a behavior to be avoided at all costs. However, thinking of ’rewards’, we could suggest that a mapping journey should include at least 20 categorized points, because otherwise why go through the trouble of automating the activity and generating a map (if there were only three spots on a map).
Now the case of the cognitivist looks much better, computer science people refer to ‘domain models’ and in psychology our assumptions about our environment are sometimes described as ‘mental models’. As such, those models have a similarity with the set of categories I had in mind when starting out to map restaurants. Mental models can be challenged by counter-examples or by new cases not fitting the model (cognitive dissonances). And the latter was also what happened to my model with just three categories. Eventually I had to create five categories ‘on the fly’
Example - Gastronomy during Covid19
- cat1 - Business as usual (Blue)
- cat2 - Limited opening hours (Orange)
- cat3 - Temporarily Closed (Red)
- cat4 - Closed & No Information (Grey)
- cat5 - Out of business (Black)
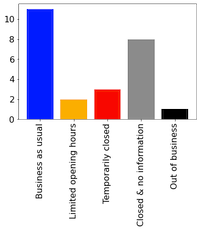
I think the biggest surprise to me was the relatively high percentage of places being closed without any information about ‘the possibility to pick up some food’ or a hint that they are actually closing due to Covid19. Then I am glad that the black category happened only once. After some reflection I also think that Covid-19 puts food places under a lot of stress since rules for operating places can and do change at very short notice. By chance we talked about this with our favorite Thai restaurant and for them getting hold of the necessary ingredients had become increasingly difficult (also a connection I hadn't thought about before).
Lastly, the social constructivist would emphasis our interaction with the real world (other people mapping or gazing at the thing to be mapped) as the main source of learning. They would also highlight that no learning is limited to a single brain or bound by a simple stimulus-response process. So the way we (selectively) look at things is influenced by our upbringing, the values and standards we get infused with on a day to day basis etc. Applying this to our ’restaurant mapping exercise’, it means that learning would benefit from a social exchange about our learning experience, e.g. discussing the categories applied as well as any alternatives. The social dimension of mapping could go on, by pondering about the effects of larger communities contributing data to a map, e.g. in order to take action on plastic pollution Open Litter Map. An elaborated example of volunteering data to a map – in this case it was the accessibility of places can be found here Collaborative Mapping and the Reliability of Volunteered Data.
The final map of the restaurant mapping looks like this:
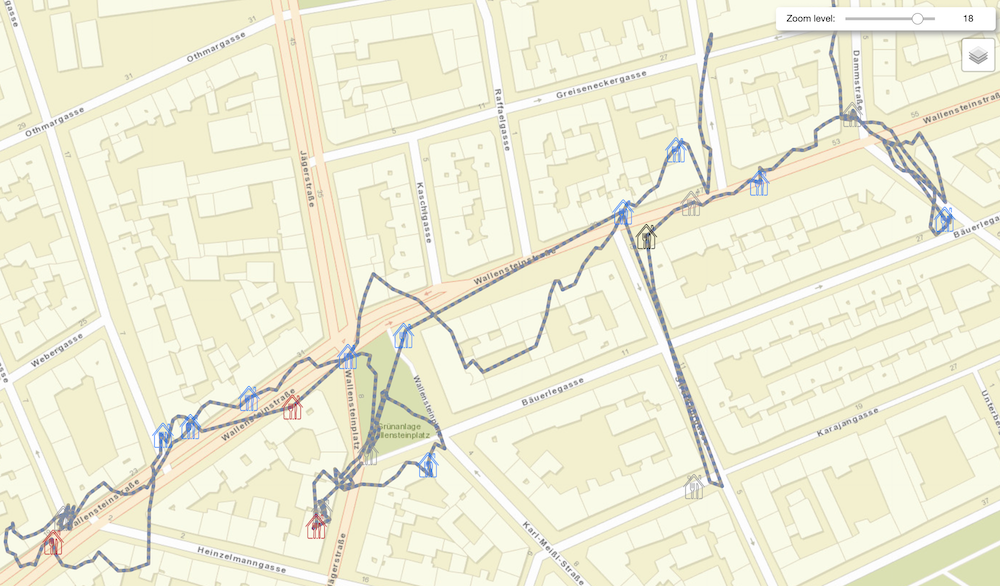
The mapping journey covered 2.807 meters, up and down the Wallensteinstraße, a major street with shops and tram stations, and took about 35 min. Extending the exercise, it would be interesting to see whether categories show a relationship with urban characteristics, e.g. whether locations in side streets are affected differently. Or at an even larger scale we could group data according to neighborhoods and see if there are areas in the city that are affected disproportionally, which again would give a good foundation to discuss about our ‘mental model’ concerning different parts of our city.
Lastly, and unrelated to the topic of restaurants, I learnt that GPS antennas need to be placed carefully without obstructing layers on top of the antenna. It worked but the precision of the geo-locations was unusually low. And there were two indicators, first, in the middle of the map the pathway shows some arbitrary detours, seemingly entering buildings (which isn’t possible since most GPS signals are blocked by roofs). So apart from human’s blurry decision making we also have machines susceptible to the conditions under which they operate (location in a bag, weather, maybe battery power etc)
So did we get an answer to the question ‘ What is informal learning when mapping?’ .. not quite, we didn’t touch on the term informal yet. Broadly speaking, compared with formal education provided in schools or higher education institutions, informal learning is more autonomous, less structured and more related to the actual practice of doing stuff. Politically, informal learning is also less entrenched in power relations (student – teacher – head of school ...) and is not bound to reach external objectives as prescribed by curricula. (cf. Malcolm, J., Hodkinson, P., & Colley, H. (2003). The interrelationships between informal and formal learning. Journal of Workplace Learning, 15, 313–318.)
Sounds like fitting to the learning while mapping experience described above, so put differently the situation defines what and how we learn best, given that we roam our environment with an open mind and keep questioning our ‘mental models’ as they generalize (for better or worse) what we know.