
Of course, you could jump straight to the building guide:
- How was the mapper developed
- What defines the observation mapper
- Data collection overview
- Building guide
Annex A: List of materials
Annex B: Software tool chain
Annex C: List of available pins for sensor extensions
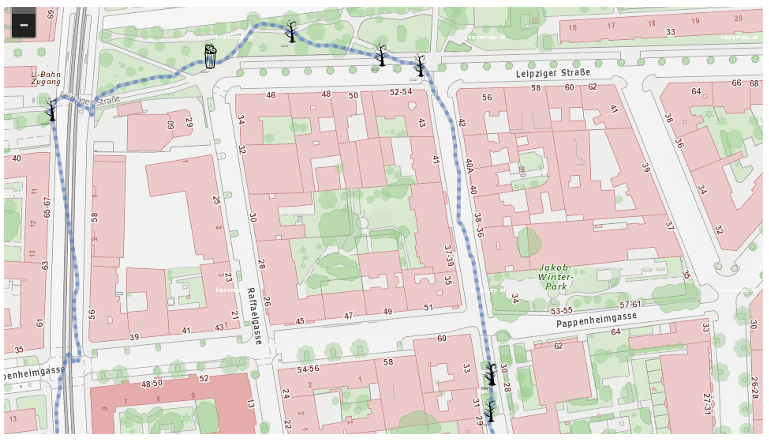
Before we dive int the nuts and bolts of 'building', let's quickly recap what the observation mapper is meant to do. The following example of 'how to map observations' looks at a hypothetical relationship between overflowing rubbish bins and increased pollution of green spots nearby. Put simply, mapping an observation means to capture the GPS coordinates where the observation was made and mapping the observation with one out of five possible categories. A 'category' would simply be a number [1-5] at first and take on a specific meaning during the subsequent analysis. Testing the 'rubish bin'hypothesis only required two categories, e.g.overflowing rubbish bins would be indicated by 'Category 1' and 'Category 2' would pin down a polluted green spot. Once the data is downloaded, categories 1 and 2 can be replaced by appropriate icons and displayed on a map together with the path (dotted blue line) the mapping person recorded. What seems a straightforward process, can turn out to be a fairly unreliable process in reality, starting with the question of whether every piece of paper (no matter how small) justifies to map a green spot as polluted. For example, one option could be to use two categories, distinguishung between 'light' and 'heavy' polution ... Nonetheless, understanding the need to specify and possibly standardize data collection can become a desirable part of the learning experience around using the observation mapper.
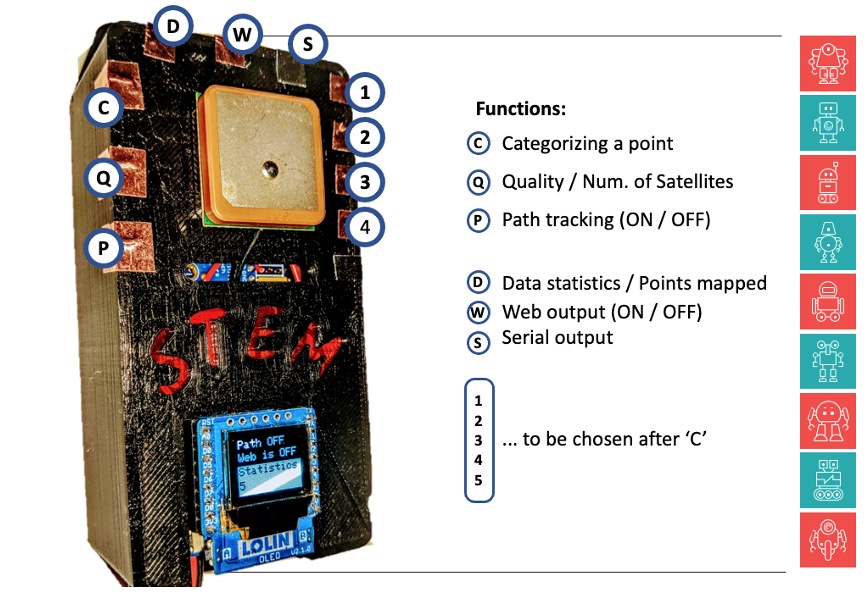
There is a depiction of the device below, including an overview of all 10 touch points, that controll the mapping process. The device aims to give as much feedback as possible during data collection, hence the inclusion of a small screen. The screen provides information on how many points have been mapped and whether the signal strength is sufficient to record GPS positions.
The device also tracks the path a person is walking while mapping. Finally, the device indicates whether collected data can be accessed through a web-browser, which simultaneously offers an option to download the collected data for further processing on a local device. At no time are data uploaded to the Internet, meaning that data are entirely under the control of the device holder.
WHY WAS IT MADE: USING DAY-TO-DAY OBSERVATIONS FOR LEARNING
The underlying idea is a link between our everyday observations and the way we learn informally, sometimes unconsciusly. ‘Mapping our observations’ can help to make that learning more conscious, maybe even surprising and interesting as it is related to our personal experiences. Hence, a central goal behind the development of the mapper gadget is the development / revision / testing of heuristics which help us to make sense of the things we observe without investing a lot of time or cognitive effort.
For example, during times of Covid19, wearing masks and keeping physical distances is proven to help society’s fight against increasing infection numbers. However, our decision as to where and when exactly should we wear masks is influenced by our assumptions (mental models) about covid19 as an infectious disease (e.g. Does it spread in a train station or only in smaller, confined spaces?; Does it matter how long we stay in one place?; Should it be a specific type of mask? etc.).
Additionally, our ‘mask wearing behaviour’ is also influenced by observing other people (e.g. politicians, peers, figures of authority) wearing masks or not. However, often we are overly influenced by what we have seen last or what impressed us most. In that sense we are rather bad in calculating averages over longer time spans or creating meaningful categorizations of our observations post-hoc. So being conscious of how our observations shape our assumptions and how we learn from our observations is a good starting point for designing ‘informal experiments’ or ‘explorative data journeys’ involving a DIY mapping device.
WHO IS IT FOR
The tool is for educators to share with their communities and for makers who have already mastered the fundamentals of using microcontrollers, who want to put their skills into practice, while building a first gadget.
As part of SySTEM2020, an EU research project two partners (Kersnikova in Ljubljana and Science Gallery Dublin) tried the gadget in the context of their workshops and courses. The main idea was to connect what they learned during non-formal workshop indoors with observations made outdoors, i.e. phenomena workshop participants could recognize in their usual whereabouts.
HOW WAS IT DEVELOPED
A few expectations have been set already at the outset, based on iniial experiences with science centers and maker spaces:
- the device should be modular;
- there should be an option for DIY;
- there should be an option for adapting and modifying the functionality of the device or the type of data collected;
- data collected, such as the GPS coordinates, should be used in reflective and sense-making activities, supported by adequate visualizations;
- special care should be dedicated to the privacy of learners.
The first discussion about the observation mapper took place during the Milan meeting (September 2019). During that occasion core building blogs such as GPS as common denominator for the data collection and Google Maps as an example for a lightweight data visualisation were introduced. However, at that time, the device had no protective casing yet and no working user interaction.
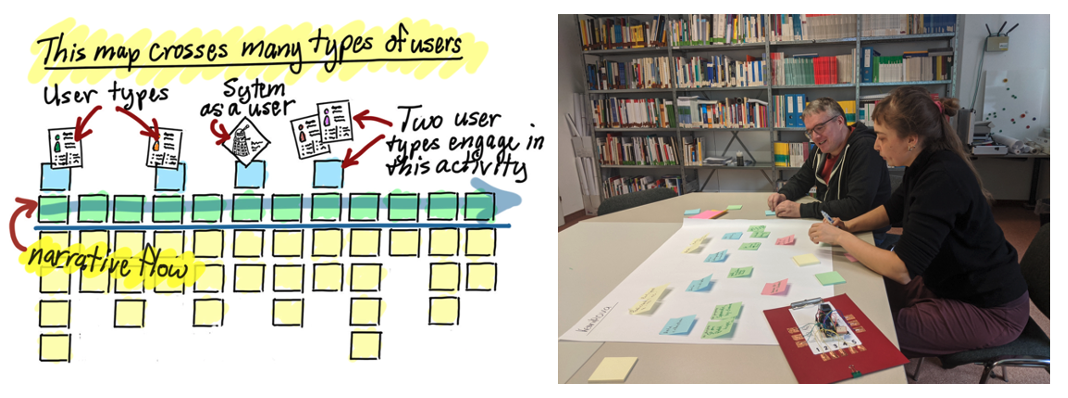
First design session followed a user story mapping approach in order to canvass potential use cases, scenarios and necessary features.
WHAT IS THE BIG IDEA OF THE WORKSHOP / WORKSHOP SERIES?
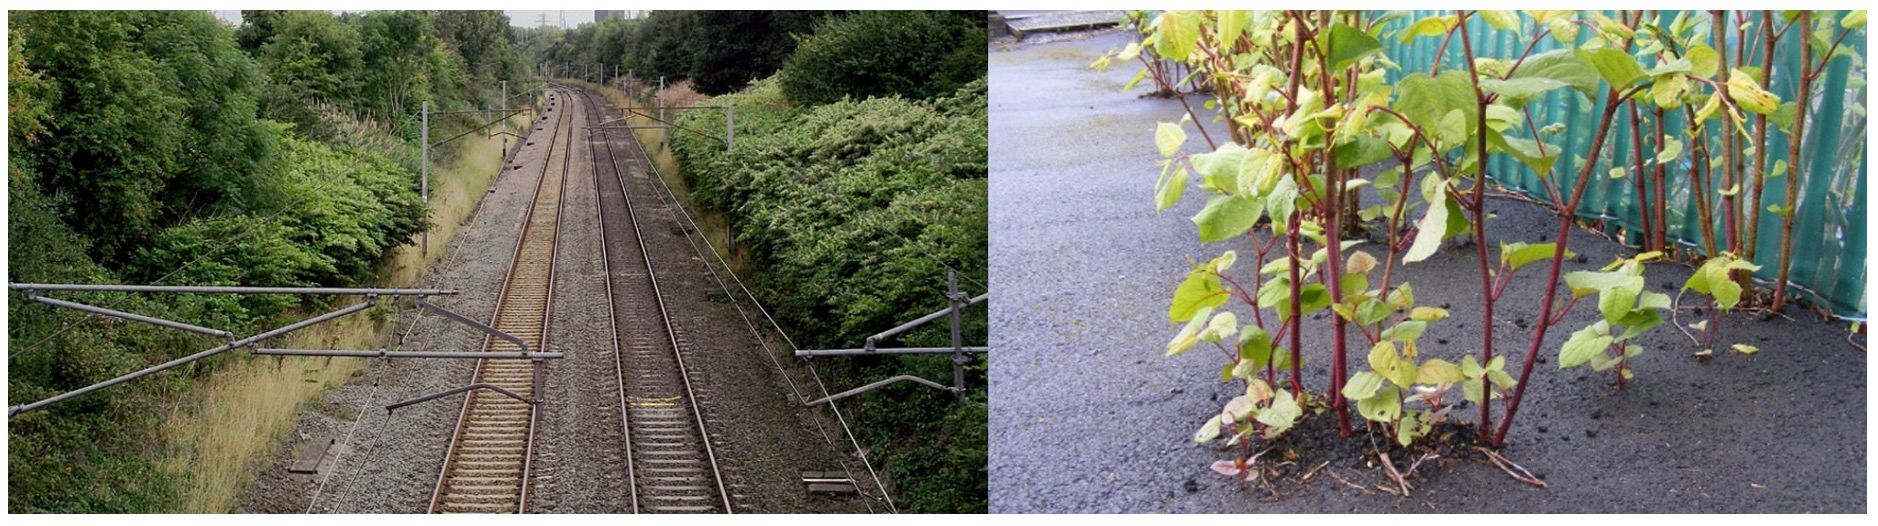
This question was mostly discussed in the context of particular workshop plans held by the organisation piloting the ‘observation mapper’. In the case of Kersnikova we started with the idea of designing a series of 4 workshops around the topic of transforming an invasive plant (i.e. the Japanese knotweed) into paper.
Knotweed are extremely hardy and able to reproduce through root shoots that are virtually impossible to remove. They overgrow large areas, mostly along watercourses, railways, in degraded areas and near buildings. It is not toxic to humans, but it is harmful to the environment, as its large leaves cover the ground and prevent the growth of low undergrowth. Also, knotweed with its roots can grow through cracks in buildings, cause cracks in concrete and asphalt, destroy insulation, and so on.
For Dublin we had the starting idea of ‘exploring litter, living with plastic and the impact of bio-plastics’, which fitted well an ongoing exhibition at the time.
We could stick to the Japanese knotweed idea, categorizing and visualizing the knotweed plants. Unfortunately, we had to skip the paper making part of workshop, since in person meetings were not allowed at the time.
Due to a mismatch between the completion of the observation mapper and the duration of the plastics exhibition, we had to drop that idea and adjusted plans to a new theme linked to a course offered to transition year students over the duration of a week. The theme of the week was data, ethics and AI. One particular issue that came to the fore, was the element of bias in data influencing AI algorithms that rely on large amounts of data. By having two people mapping the same phenomenon, the plan was to compare and discuss circumstances that could lead to categorizing observations differently. Ultimately leading to different conclusions. The specific topic of the mapping journey were ‘emotional impressions’ in Dublin related to Covid-19. ‘Emotional impressions’ could include graffiti, decaying corners, empty shopping streets, people wearing masks etc.
WHO ARE THE USERS? HOW WOULD THEY BE USING THE MAPPER?
Under this question we discussed mainly what skills do users bring to the table already. For example, in the case of Ljubljana the engagement tracker was used with a group of programming affine youngsters, which allowed us to use more advanced tooling for data analysis and visualization (e.g. Python Notebooks and/or Binder ). In Dublin, users had a more diverse background and no programming experience could be assumed, hence we stuck to Excel and Google Maps. In both cases, the important steps centred on participants discovering interesting ways of ‘questioning’ a set of data.
WHAT DEFINES THE OBSERVATION MAPPER
The device is aiming to respond to a number of specific needs such as:
- Variety of use scenarios: Depending on the time available, the gadget can be used pre-built so that the focus is on using local data during coding sessions, visualizing the data and their positions in bar charts and maps respectively. Or, alternatively, parts can be organized and assembled during a session, which is recommended if you want to go on modifying or extending the gadget later on.
- Moderate price point for components used: All in all, a total bill of approx. 30 € should suffice. As usual, components can be reused in many different scenarios.
- Modular design and extensibility: Based on open-source software, the mapper’s functionality can be extended by choosing from a wide range of sensors, e.g. measuring air quality through parts per million (PPM) or understanding urban weather through measuring the temperature of heat islands in densely built-up areas (see Annex C – for a list of pins available for additional sensors). At the moment only the GPS sensor is a fixed component, since this is the underlying meta-data, needed to pin an observation on the map.
- Privacy respecting use: There is no central learning management system and the data collected are not uploaded to the Internet at any time. Hence, the activities of young learners (where and when they collect their data) are kept private. It might not look like much, but in times when our data power the algorithms of tech giants, mapping can contribute to an awareness of how much data we generate by simply carrying around smart phones with integrated GPS sensors.
However, the most important ingredient to ‘learning from observations’ is not the technology but an overarching story, motivating kids to be curious and explore relationships between observations, data and insights.
SUGGESTED SCENARIOS
Due to Covid19 regulations, we could not organise outdoor observations in small groups as planned. Still, workshop facilitators could map observations in their respective cities (Ljubljana and Dublin) and provided these local datasets to workshop participants, who then explored, visualized and analysed the data and the underlying phenomena in online workshops.
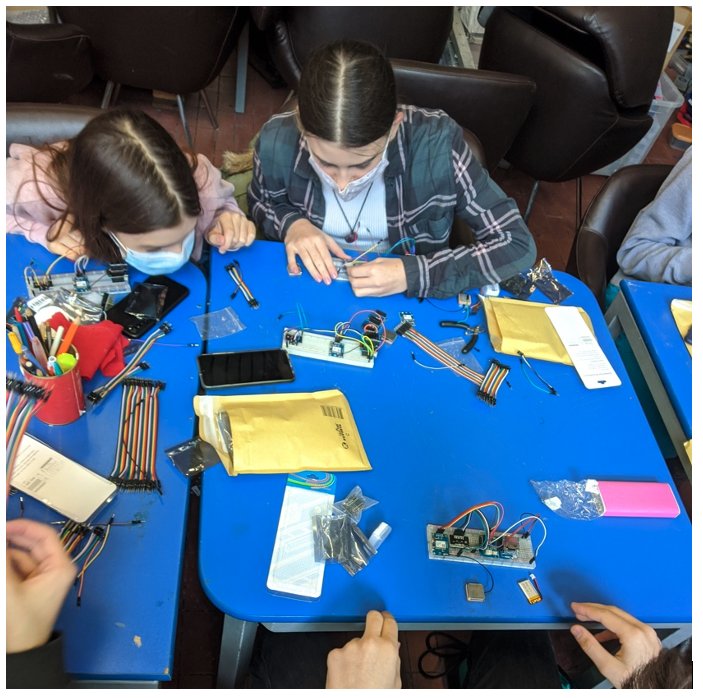
However, going through the whole process of soldering the data collection device yourself and also collecting the data outdoors before you go on and analyse them does make a difference. This effect was also confirmed by the first pilot, who worked with the data first and build the gadget during a follow up workshop (see image below).
On a modular basis there are five ‘starting points’, where workshops can start and make use of the ‘observation mapper’. Each starting point allows for a different focus and could be offered in isolation if observation mapping devices are already available or data had been collected beforehand (as it was the case for our two online workshops in Ljubljana and Dublin).
DATA COLLECTION
The data collection process itself is straight forward, though it should be demonstrated once at the beginning of the workshop. Steps during the data collection process can be separated into ‘mapping’ and ‘monitoring’.
Mapping: After starting the mapper (see Figure below), screen one shows for 2 secs - the robot being a reference to the projects icon - followed by screen two, indicating that the device is ready to map. If the user is in front of a relevant observation, she / he can enter a mapping category as indicated on screen three.
Monitoring: Once a user has been mapping for a while, she/he can check the statistics of how many locations have been mapped (screen four). In the two pilots we had so far, more than 100 places have been mapped. Likewise, it’s possible to monitor the number of satellites the GPS is reaching. Particularly in narrow streets, close to high buildings, it can be advisable to check GPS accuracy.
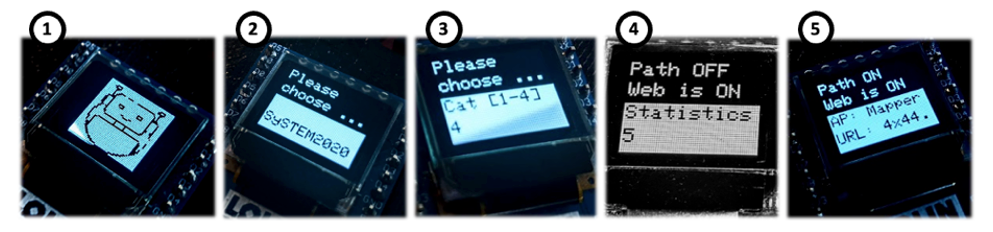
As we can see in the upperpart of screen four, while categorizing specific locations, the gadget has two more features that could run in parallel: tracking the path of the user (Path ON/OFF) and enabling on the spot checking of the collected data through the browser (Web is ON/OFF). ‘Web is ON’ creates an access point (similar to a WiFi hot spot) which any mobile device can access. Screen five gives a reminder of the access point’s name (‘Mapper’) as well as the URL that needs to be called in the browser (‘http://44.44.44.44’).
Once the access point is running, we see a tabular overview of the spots mapped so far. The figure below shows all points making up the path of the mapping person. We can see that path markers are taken every 3 seconds, but we also see a glitch at 07:36:53, when the same path marker has been recorder three times. Later on, the analysis will filter out duplicates, so that each data point is unique. We could get a similar overview from the points categorized and since the table can be sorted by each column, we could also get a rough idea of how often each category has been used.
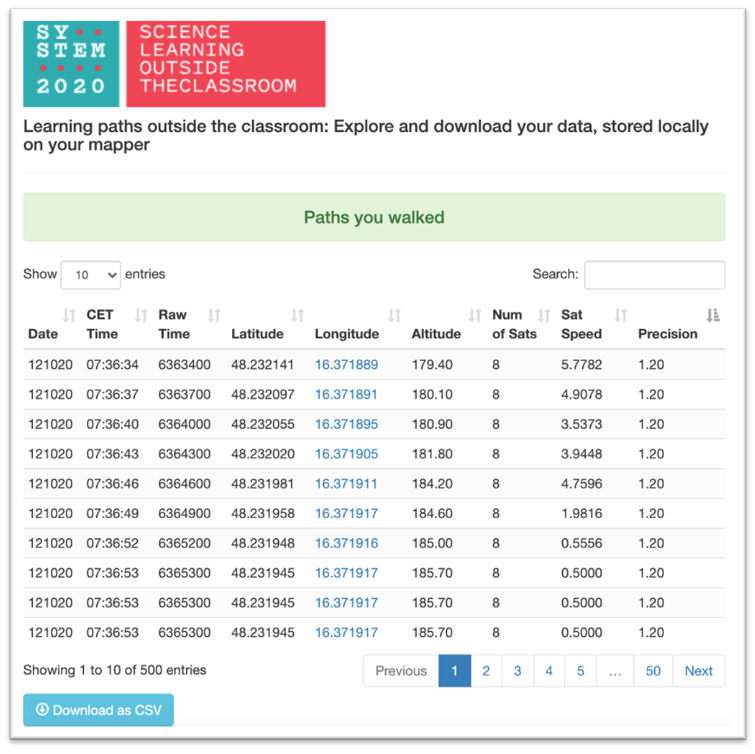
Below the table there is also a button for downloading the data as a CSV file, which can then be processed by several data exploration tools, somehing to be described in anoher post.
BUILDING TIPS
Step 1: Getting all materials and tools ready, connecting the pieces and (optionally) soldering
Make sure you have all materials need and a solid set of tools you feel comfortable with. You find a complete list of components in the Annex. All in all you might expect to shell out 30 € for components.
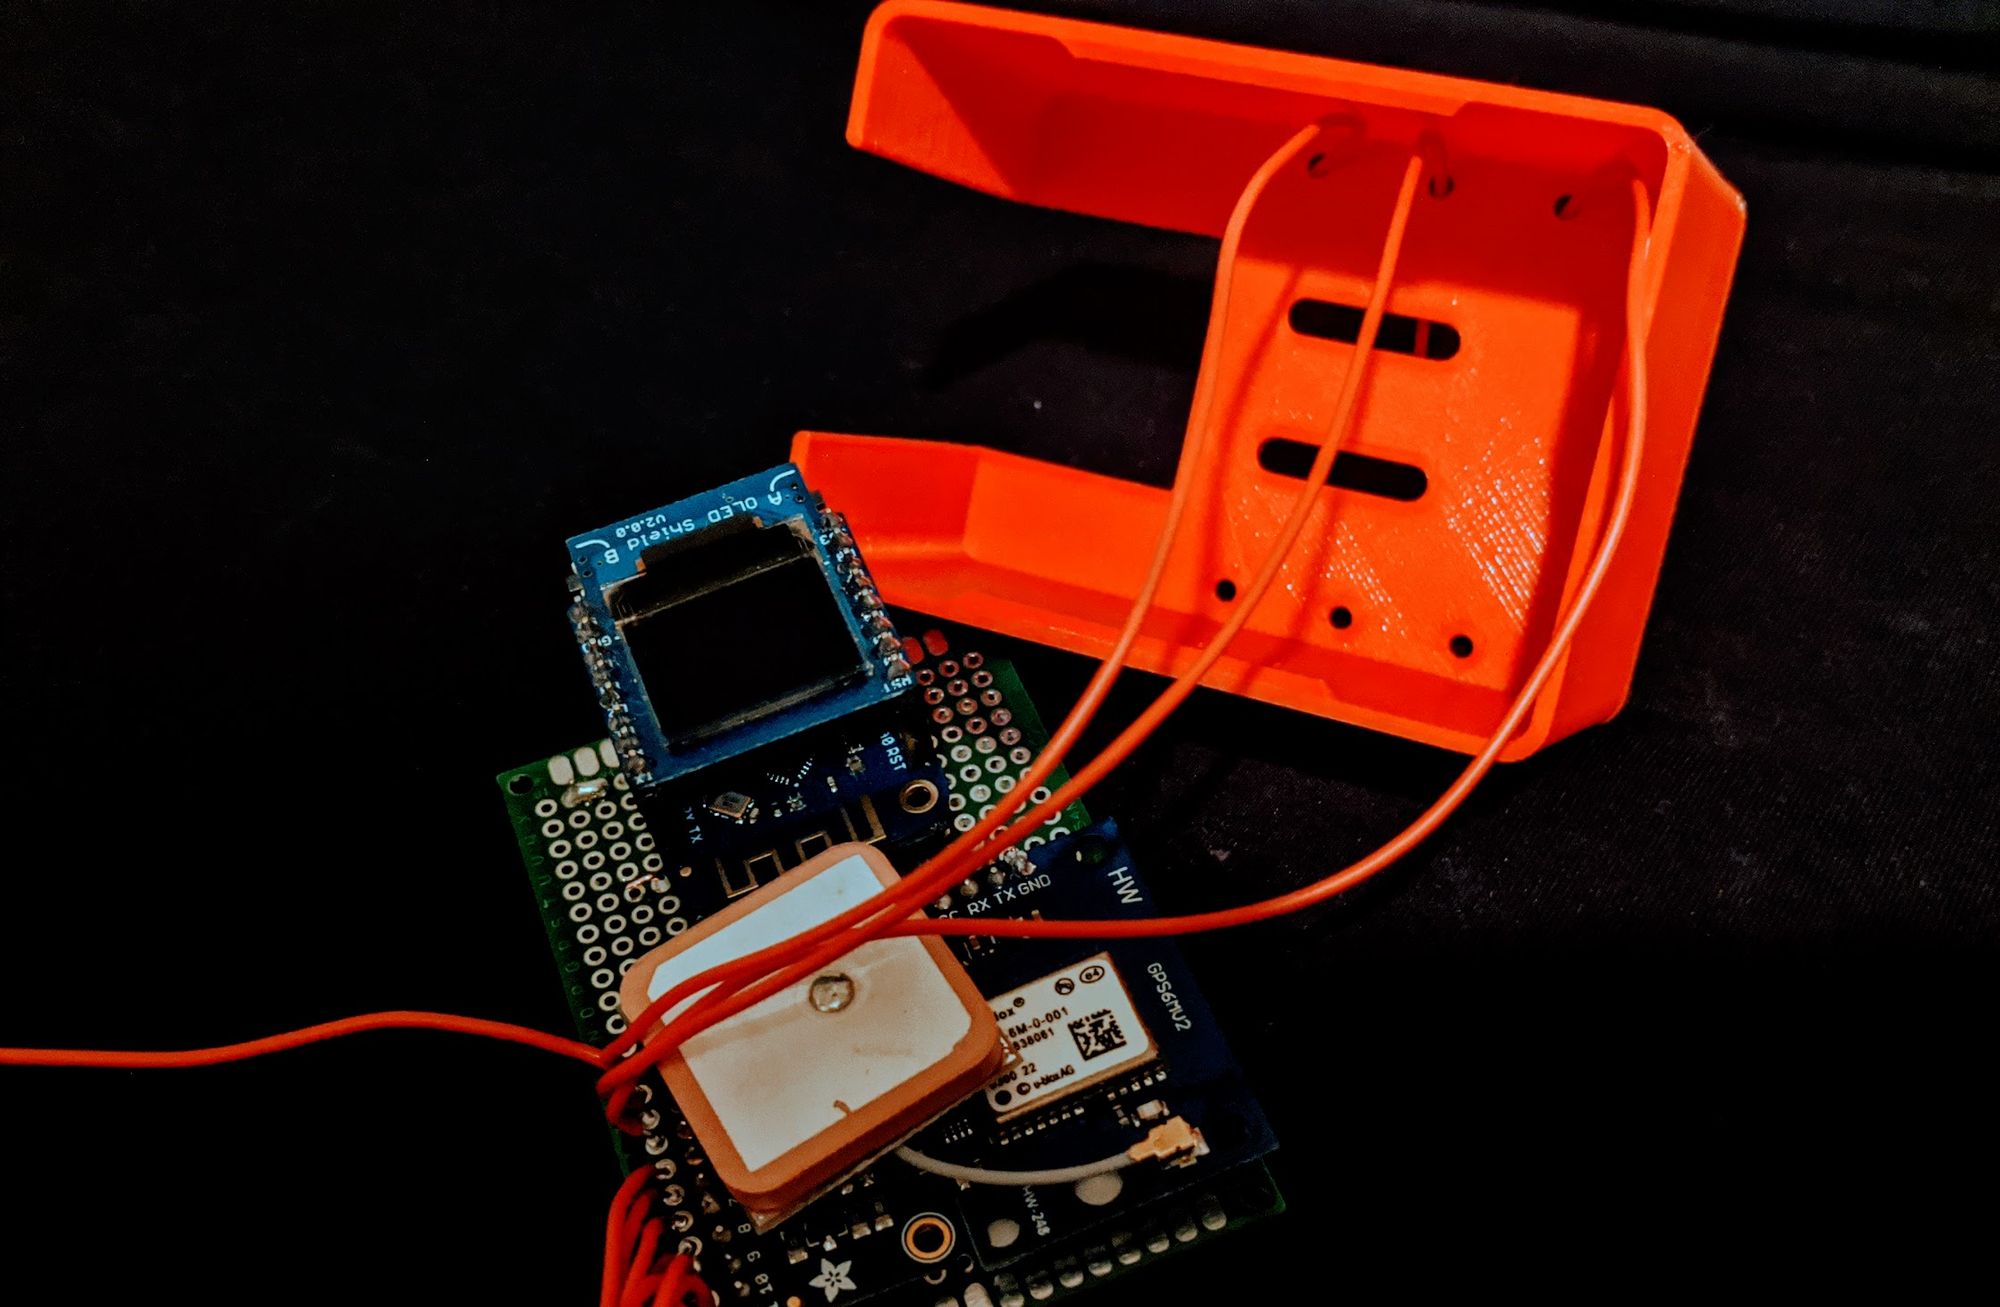
As for tools, if you go for the experimental breadboard version (see image below, left), you don’t need any tooling. If you got for the hard-wired version (see image below, right), you need the usual soldering iron, solder and maybe a stripping plier.
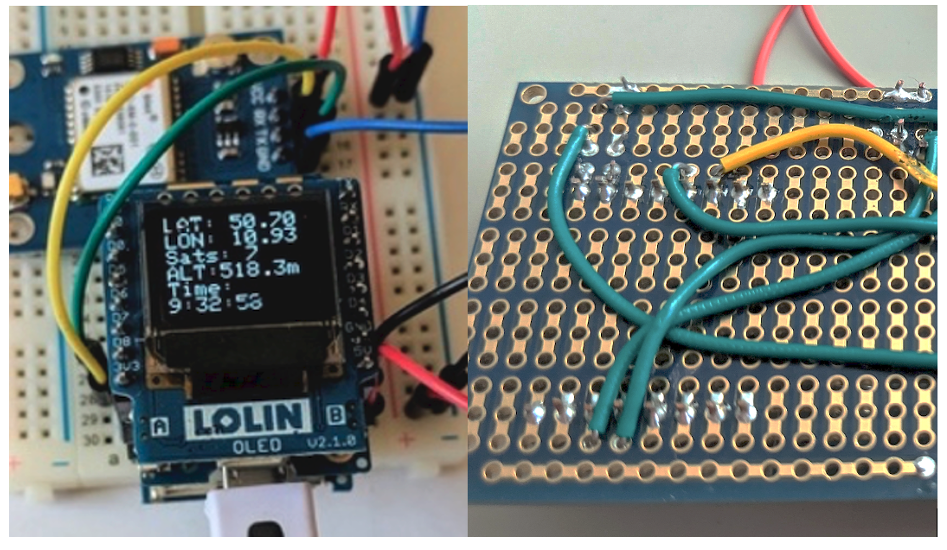
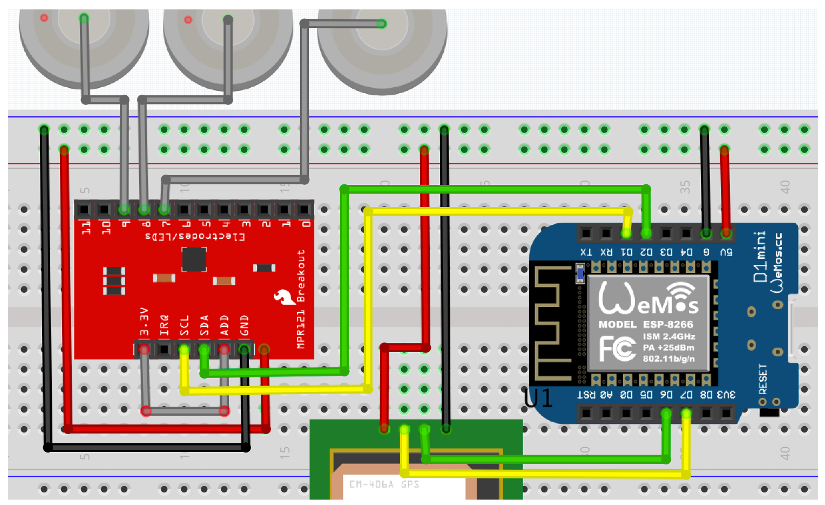
Before you can see an working hardware, you want to make sure all pieces are connected in the right way. That’s actually easier than it might look at a first glance. There are three pieces that belong to the Wemos Mini Ecosystem (microcontroller, battery charger, display) and two more components which use I2C communication. In sum this means we have to take care of 2x4 wires (look out for the green, yellow, red and black wires below).
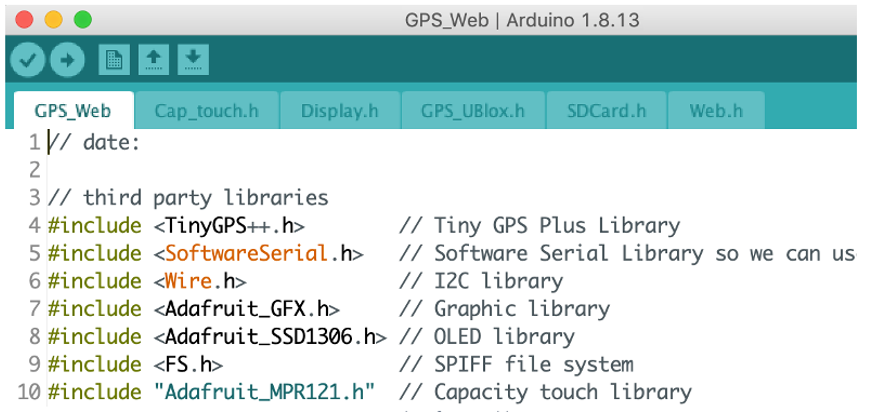
Step 2: Uploading the sketch and making (optional) adaptations
The sketch can be found on Github, which makes sure that you get the latest version with improvements and bug fixes: https://github.com/chrvoigt/observation-gadget
But bevor you can upload the sketch to your DIY mapping device, you need to get your tool chain ready (see Annex B).
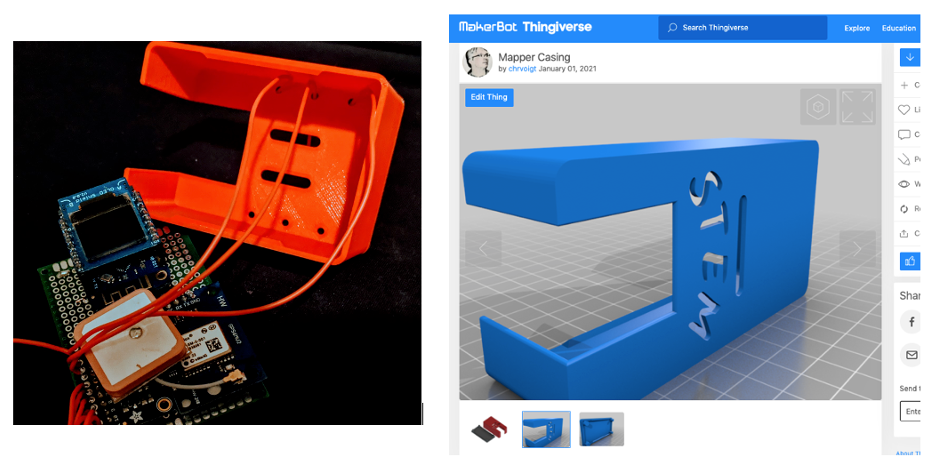
Step 3: 3D-Printing the casing
Just like the code to be flashed on the device, the design of the casing is also made openly available on two prominent websites:
• Thingiverse https://www.thingiverse.com/thing:4664256
• Wikifactory https://wikifactory.com/@chrvoigt/mapper-casing
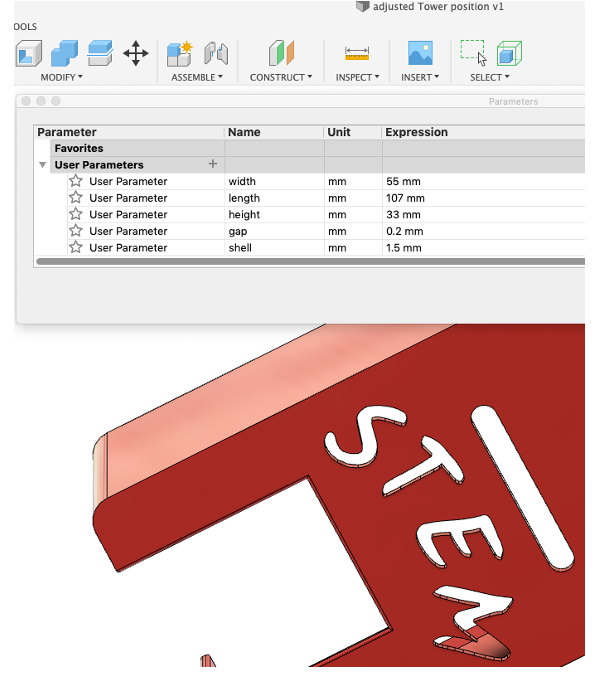
These archives include the original design files, needed to make adaptations in Fusion360 , which has educational, free licences as well. The dimensions of the box can be easily adapted through parameters, so that workshops can print casings according to the size of their printed circuit boards (PCB). Equally, the cut-out text – currently saying ‘STEM’ – can be replaced with another word.
Annex A: List of materials
Important: The links to buying options are no endorsement, still, I find that having a link is useful as you can then compare details as well as have a starting point for what could be a reasonable price.
1. MPR121 Capacitive Touch Sensor ≈ 3 €
2. Wemos D1 (ESP8266) ≈ 5 €
3. OLED Shield ≈ 5 €
4. Battery charger ≈ 3 €
5. PCB Prototyping shield ≈ 1 €
6. NEO-6M GPS ≈ 6 €
7. LiPo Battery ≈ 5 €
8. Breadboard for testing
9. Wires
Total: ≈ 30 €
Example Links
https://electronics.semaf.at/MPR121-Capacitive-Touch-Sensor-Breakout-Board
https://electronics.semaf.at/OLED-066-Shield-for-Wemos-D1-Mini-Board
https://www.amazon.de/gp/product/B08GM2W6PM
https://www.amazon.de/gp/product/B07V6C5J7P/
There is an option to replace the Wemos D1 by the MakerHawk ESP8266 WiFi Development Board (≈ 10 €), including charger, microboard and OLED all in one. This could bring down the cost to 25€, while making the hardware more compact.
Annex B: Software tool chain
- Install the Arduino IDE for your operating system (Windows, MacOS, Linux)
- if you use Windows, you need to install a driver (CH430):
a. Download site: https://www.wemos.cc/en/latest/ch340_driver.html
b. A description with screenshots https://www.dnatechindia.com/ch340g-drivers-download-installation-guide.html
c. Restart your device - Install the ESP8266 board and associated libraries to your Arduino IDE. A pretty good description can be found here https://randomnerdtutorials.com/how-to-install-esp8266-board-arduino-ide/
- Before flashing you might need to install a number of libraries, specially if you are using Arduino for the first time. However, the IDE will tell you if that is needed during the compilation process (see below the list of libraires used by the mapper). At the time of writing (January 2021) the sketch worked with the latest versions of all libraries.
-
Unfortunately, one library needs to be installed manually. This is going to be improved in the future, but for now there is a process description http://arduiniana.org/libraries/tinygpsplus/
-
Next, we need an extension of the Arduino IDE so that we can upload files to the files system. As a result, you should see a new entry under Tools saying ‘ESP8266 Sketch Data Upload’
We need to upload two pieces of software:
• the sketch, this is how the program is called, that makes all pieces of hardware talk to each other;
• and a website, which allows us later to connect our smart phones or laptop directly to the mapping device in order to download the website that allows us to check our data on the go and finally download our data for further visualization.
The folder you can download from Github, contains already a folder called ‘data’, there we included all files needed for displaying the website. -
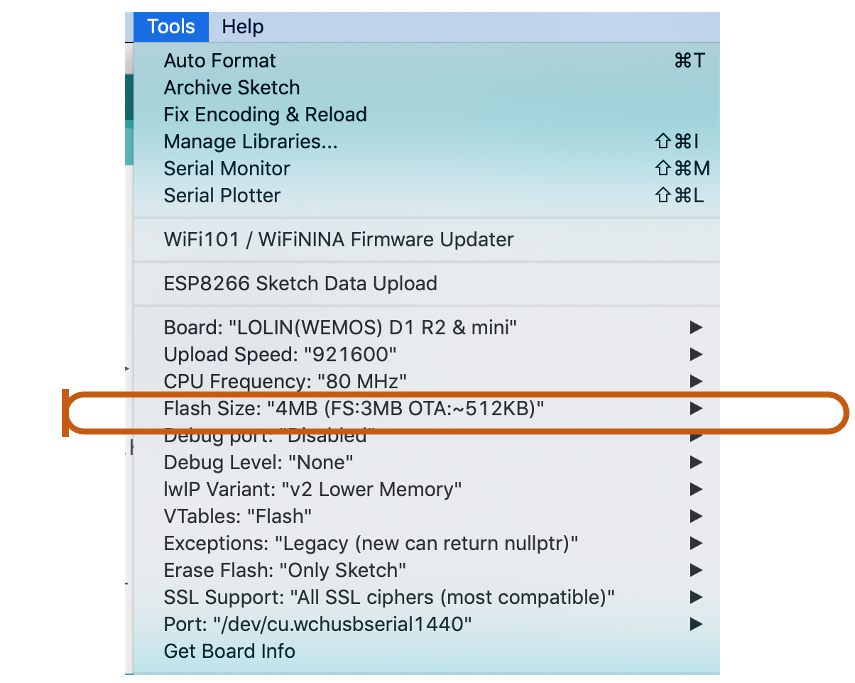
Last but not least, we need to resize the flash memory to provide sufficient space for the data we are going to collect. We recommend reserving 3 MB for the file system (FS).
Annex C: List of available pins for sensor extensions
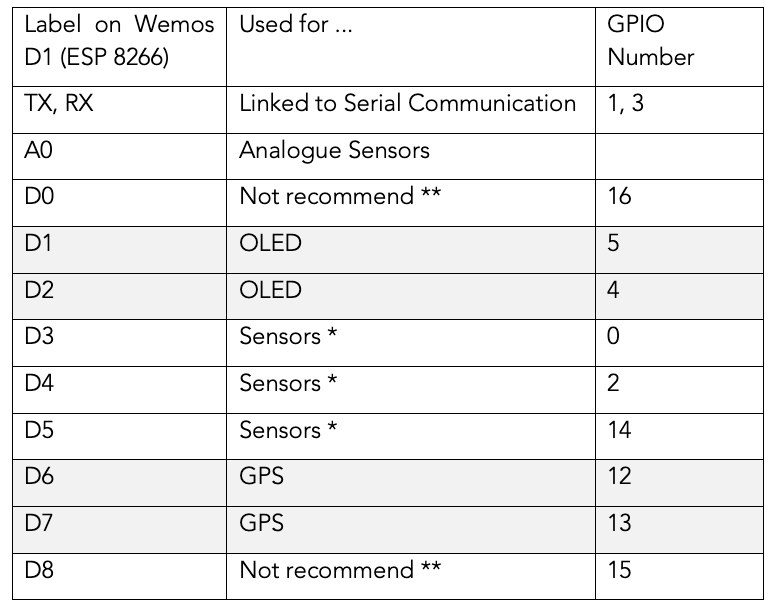
(* e.g. a DHT22 sensor running on 3.3 V
(**https://docs.google.com/spreadsheets/d/1pQuBocanzCZJ3KPUpu3VvpOOBzboqXDuwQDVP5UYcXc/edit#gid=0
Comparison between ESP8266 and ESP32 https://makeradvisor.com/esp32-vs-esp8266/